This feature is particularly useful in situations where the relationship between variables is not constant or linear.
The classic display style, where the plot has time on the X-axis, is very common and likely the only one needed by a standard user. You see the time and all the data row values sampled according to a consistent time span difference, which is always the same.
However, a car does not maintain the same acceleration rate at all times. As a result, the RPM curve is not straight, and other values that are RPM-dependent are also curved. If you want to analyze what happens directly according to RPM, with the same RPM division rate, this function is for you.
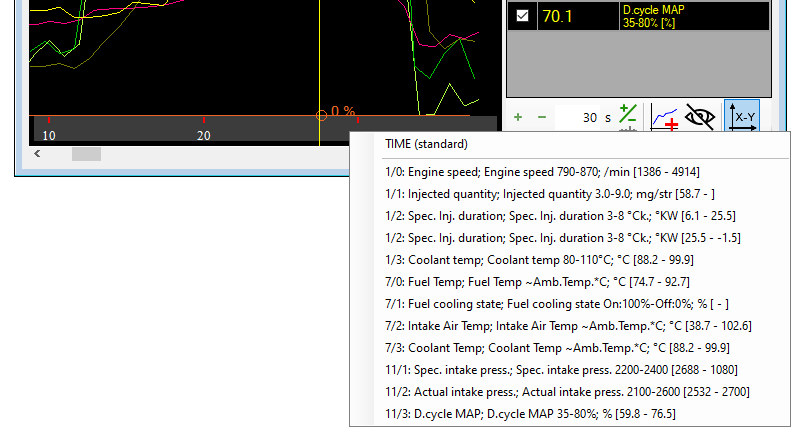
You can swap the RPM values to the X-axis, and you will see all the other data rows according to an RPM value at that point.
Important note: This function works only for a specific segment of data row values, specifically for the monotonous part of the data row (curve). Therefore, if the curve you wish to place on the X-axis is transitioning from rising to falling around the main cursor, it will offer you two ranges, and you can choose only one.”
This feature is useful for detailed analysis of dynamic systems where the rate of change is not uniform. By plotting RPM on the X-axis, you can observe how other variables behave in relation to RPM, which can reveal insights into the system’s performance that might not be apparent with time-based plotting. It’s particularly valuable for diagnosing issues or optimizing performance in mechanical systems like engines.