Single plot curves can be displayed or hidden using several methods. The most comfortable way is to use menu located directly on the Control panel.
This allows you to switch a visible state of each curve separately.
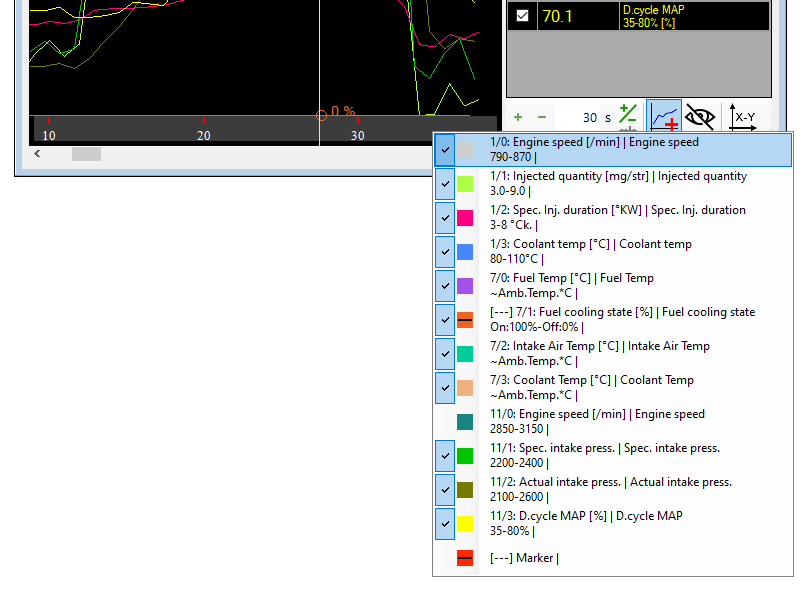
You see a curve identificator, unit, description name, visibility state and even const marker.
[—] const marker tells you the curve/datarow has only constant values (only one value all the time). This is extremely helpful when you log a huge amount of parameters and you need to quickly distinquish constant and variable values. The same is indicated in a color square using horizontal line. Variable value curves have a clean color square.
Datarows filtering
If you have many datarows/curves in your list it is extremely helpful to use a filter function.
Use your keyboard to type text after opening datarow list menu. This will cause to filter menu items according to your written text. The video shows you how to use this function.