This function allows you to switch visible state of specific group of curves (datarows).
You can:
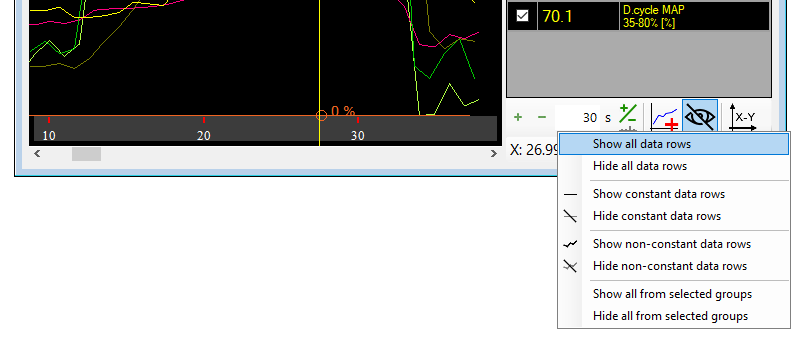
- Show or hide all data rows
- Show or hide constant data rows (shows or hides all curves which have only one constant value all the time)
- Show or hide non-constant data rows (shows or hides all curves which have variable values)
- Show or hide selected groups – that works for plots with groupped curves (this does for example VCDS)
Example – how to show only non-constant curves..
Method 1:
- show all data rows (only if some some data rows are hidden)
- hide all constant data rows
Method 2:
- hide all data rows
- show non-constant data rows
Each way is better in different situation.