Control panel contains a very useful menu showing after clicking the toothed-wheel button on the right side. There are mostly settings for displaying curve/data-row names and information about datarows.
Datarow/curve names display
Each datarow/curve can have up to 3 identificators:
- ID (unique ID)
- Name
- Description
Logger application typically provides one, two or three of them. First great function of Plot settings is to change how plot curve/datarow in the legend table will be displayed. Standard settings is Name but user can change this settings.
Example 1: Vehical BMW basic log
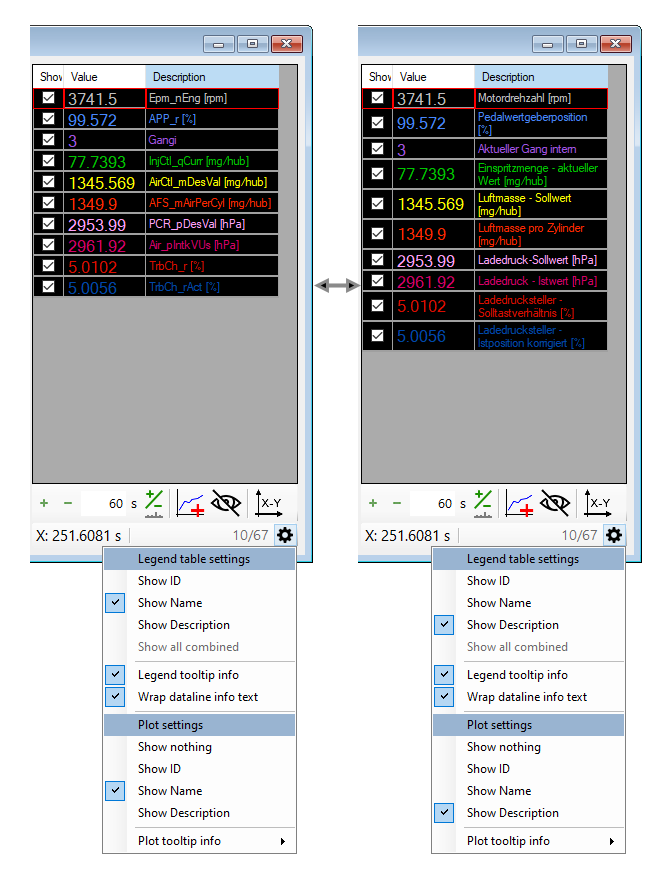
You can change this either for plot or either for legend table. If you change one of them Logview asks you whether you want to change the display also fot the other region.
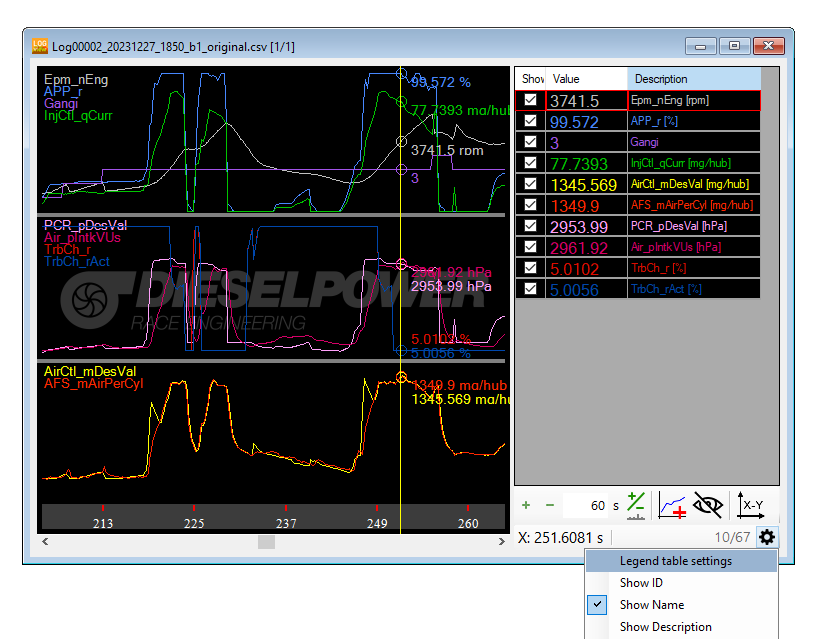
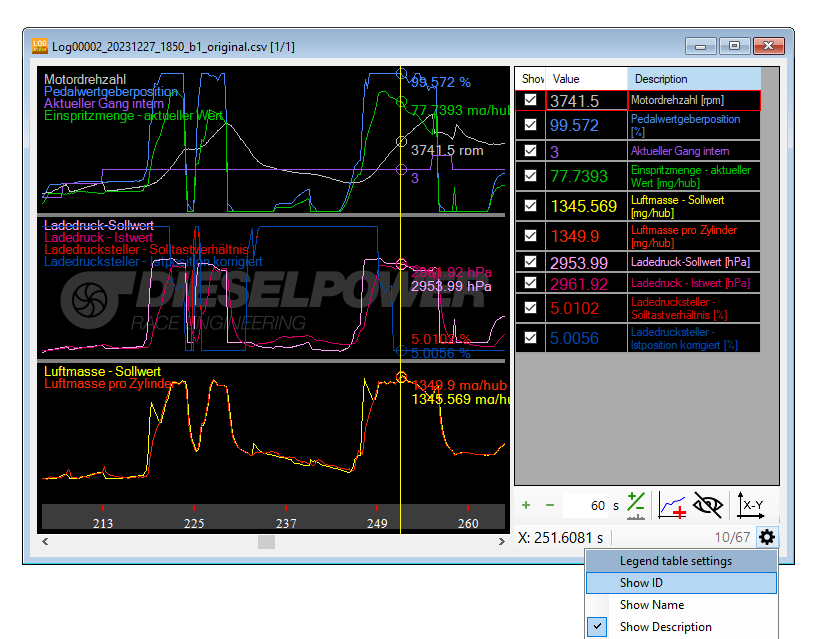
Example 2: Vehical TP2.0 basic log
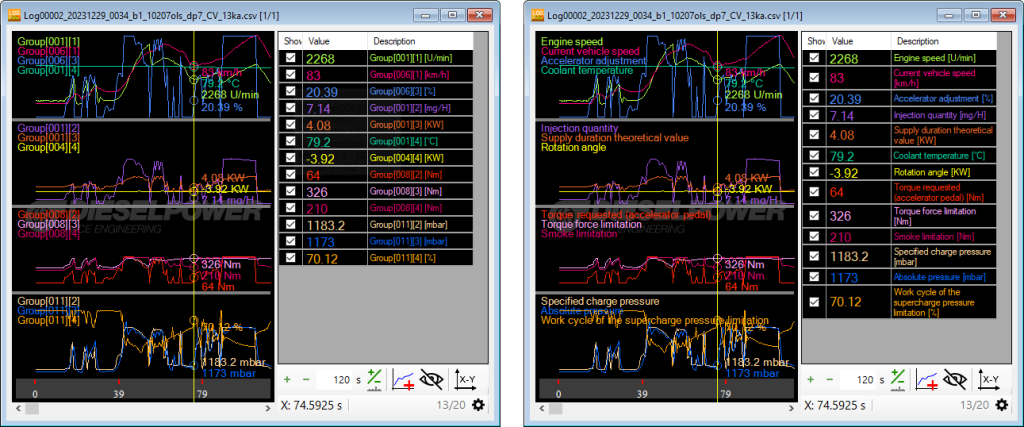
Plot settings changed from Names to Descriptions
Legend table – tooltip info
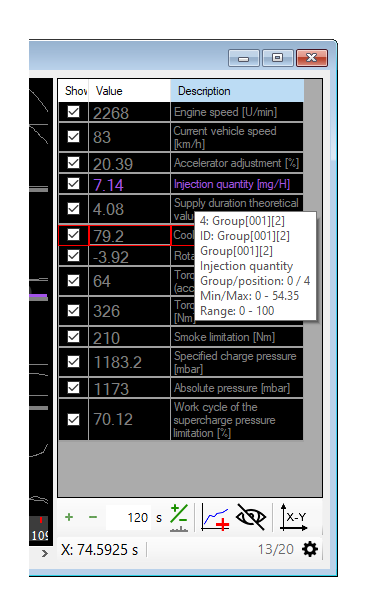
If you switch a Legend tooltip info ON (default) you will see a tooltip information while moving mouse cursor over each item in the Legend table.
This information is displayd:
- ID
- Name
- Description
- Group order
- Min/Max value
- Value range display settings
For example, you can quickly check whether display range matches values of the datarow without opening any other window.
